Sayılar #12

Subitizing/altlandırma: Küçük bir gruptaki obje sayısını saymadan bilme yeteneğidir.

(Subitizing: Türkçe karşılığı “ani” olan Latince’deki “subitus” kelimesinden türetilmiştir.)

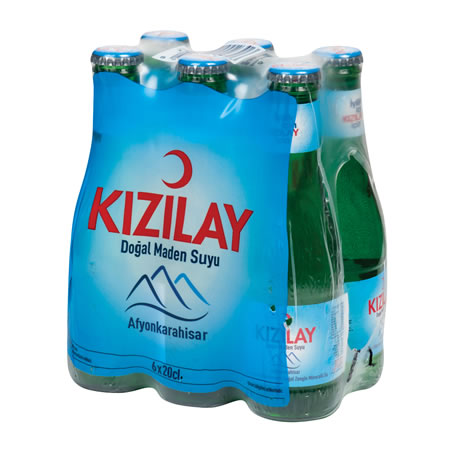
Gündelik hayatta altlandırmayı kullandığımız birçok durum vardır. 6’lı pakette soda aldığımızı farz edelim. Soda şişelerini buzdolabına nasıl dizersek dizelim şişe sayısının 6 olduğunu biliriz. Aslında bu bilgiye soda şişelerini saymamıza gerek kalmadan ulaşırız. Eğer soğuyan sodalardan birini içmeye karar verirsek, geriye 5 adet soda kaldığını bilgisine de yine sodaları saymadan ulaşabiliriz.

Hangi zarın kaç olduğunu üzerindeki noktaları saymadan biliyorsunuz.

Altlandırma için bir başka örneği tavla oyunundan verebiliriz. Diyelim ki attığımız zarlar 2 ile 5 geldi. Bu bilgiye ulaşırken harcadığımız süre neredeyse saniyenin onda birleri kadardır. Hatta, gelen zarların kaç olduğuna karar verirken harcanan süre tavla oyununu oynadıkça kısalabilir. Yani altlandırma, zamanla ve üzerine çalışıldığında gelişebilen bir yetenektir.

Kimi bilim insanlarının araştırmalarına göre 6 aylık bebekler 1, 2 ve hatta 3 kavramına görsel(3 defa zıplayan top) ve işitsel(3 defa alkışlamak) olarak sahiptir. Bir diğer deyişle insan doğduktan sonra sayı kavramını hızla geliştirmeye başlar.

Kebab Truck ve Altlandırma

Kebab Truck oyununda altlandırma; gelen müşteri gruplarının sayısında gizlenmiştir. Oyun oynandıkça daha yüksek skorlara ulaşılır. Bunun nedeni zamanla altlandırmanın gelişiyor olmasıdır.

Kebab Truck’ta müşterilerin aşağıdaki gibi geldiğini düşünelim:

Oyunda tecrübe kazandıkça bu durumda yapacağınız hamle, oyuna acemi iken yapacağınız hamlelerden çok daha farklı olur. Bunun en önemli nedeni, zamanla altlandırma yeteneğinizin gelişmiş olmasıdır.

Kebab Truck oyununun geliştirdiği bir başka yetenek ise basit aritmetik becerileridir. Bu beceriler sadece müşteri sayılarını toplama ve çıkarma ile sınır değildir. Skor sisteminin nasıl formüle edildiği çözülünce (gelen müşteri gruplarından maksimum skoru elde edebilmek için) çarpma işleminin de oyunun bir parçası olduğu anlaşılır.

Numbers #12

Subitizing: The ability to recognize(or guess) the number of a small group of objects without counting.

The name subitizing comes from the Latin word “subitus” which means “sudden”.

Subitizing can be seen in many every-day activities. One of them is a six-pack soda. No matter how they are lined up, we know that the number of soda bottles is 6. We inherit this knowledge without counting the bottles. And if we decide to drink one of them, we automatically know(without having to count them) that the number of soda bottles left is 5.

You don’t have to count the dots on the surfaces. You just know that it is 5.

Another example of subitizing can be given from the game backgammon. Assume that two dices are rolled and you identify them as 2 and 5. The process of identifying the dices can be measured in milliseconds. This can be even shortened as you spend more time playing the game. In short; subitizing is a skill that can be developed if one spends time and work on it.

Research studies showed that 6-month olds can differentiate, visually (a top bounces 3 times) and from sounds (clapping hands 3 times), between 1, 2, and even 3. In other words; humans start developing the number concept when they are just infants.

Kebab Truck & Subitizing
Subitizing is hidden behind the number of customer groups in the game of Kebab Truck. As the game is played, scores become higher and higher. The reason behind this is that players’ subitizing skills are improving.

Let’s check this scene from Kebab Truck:

In the beginning, you will be making certain moves during the game. Nevertheless, in time, your moves will differ substantially. The biggest reason behind this is that your subitizing skills were improved while you were playing the game.

Kebab Truck also helps the players to develop their basic arithmetic skills. These improvements are not limited to adding and subtracting the number of customers. Once you understand how the scoring system formulated, you will realize that (to maximize your scoring) multiplication is an important part of this game as well.

Matematik Atölyesi – Garip Dünyalar #18

Her sene Aralık ayı gelip çattığında şehirlerin görüntüsü bir anda değişir. Etraf yeni yılın gelişini müjdeleyen süslemelerle donatılırken alışveriş merkezlerinde, ofislerde ve hatta evlerde aşağıdaki gibi süslere rastlanır:

Ali hoca da her sene olduğu gibi sınıflarını süslemeye başlar. Fakat hoca, bu seneki süslemelerinde matematiği de kullanmayı aklına koymuştur.

Yeni Yıl Süsü Oyunu (Y.Y.S.O.)

Ali hocanın yarattığı Y.Y.S.O. iki kişilik bir oyundur. Bu yüzden sınıftaki öğrenciler ikişerli gruplara ayrılır ve her grubun kazananı bir sonraki tura yükselir. Oyunu kazanan öğrenci yeni yıl süslerinin sahibi olur ve sınıfı istediği gibi süsleyebilir.

Oyunun İçeriği

  • Her grupta aşağıdaki gibi 4 adet süs vardır:
  • Oyuncular sırayla bu süsleri birbirine dolar.
  • Dolama işlemi rakipten gizli yapılır.
  • Süsleri dolarken her oyuncunun en fazla dört hamle şansı vardır. Hamleden kast edilenin ne olduğu şöyle bir örnekle gösterilebilir:

İlk hamlede kırmızı süs aşağıdaki gibi dolandırılıyor olsun:

Bu, bir hamle sayılır. Kırmızı süs, mavi ve yeşil süsün altından geçirilmiştir. Sonraki iki hamle sırasıyla sarı ve mavi süsten gelsin:

Sarı süs, yapılan hamleyle yeşil ve kırmızının altından geçirilmişken; mavi süs, yeşil ve sarının üstünden geçirilmiştir. Böylece üç hamle sonucunda süsler yukarıda (sağda) görüldüğü gibi birbirine dolandırılmış olur.

Süslerin bu birbirine dolandırılmış hali aslında bir örgüdür.

Oyunun Amacı

Bir turdan galip ayrılmanız için rakibinizin yaptığı örgüyü ondan daha kısa sürede çözmeniz gerekir. (Not: Örgü çözüldüğünde ilk durumdaki gibi sıralanmış olmalıdır. Yani, yukarıdaki örnek için örgünün çözümünde süslerin renkleri soldan sağa sırasıyla sarı-yeşil-mavi-kırmızı olmalıdır.)

Örgüler

Hayatın içinde önemli bir yere sahip olan örgüler sadece yıl başı süslerinde değil, her an yanı başımızda kendini gösterir. Bazen bir peynirde, bazen saç şeklinde, bazen de bir sepette:

Kimi zaman da bir bileklikte:

Matematikte örgünün ne manaya geldiğini anlamak için Avusturyalı matematikçi Emil Artin’in 1920’lerde yaptığı çalışmalara göz atılabilir.

Gelin aşağıdaki örgüye birim örgü diyelim:

Ali hocanın oyununda amaç herhangi bir örgüden birim örgüye dönmekti. Bunu yapabilmek için Artin’in açığa çıkardığı bazı örgü özelliklerinden yararlanabiliriz.

Birinci örnek: İki ip ile örgünün çözülmesi.

Diyelim ki aşağıdaki gibi iki ipimiz olsun:

Soldaki, sağdakinin altından geçiyor.

Bu ipin tersi aşağıdaki gibi olur:

Bu sefer sağdaki, soldakinin altından geçiyor.

Eğer bu ikisi birleştirilirse ipler (uçlarından tutularak gerdirildiği takdirde) birim örgü haline döner:

İkinci örnek: Üç ip ile örgünün çözülmesi.

Üç ip alın ve aşağıdaki gibi örgü haline getirin:

Bu örgüde (yukarıdan aşağıya doğru) 3 kesişen yer vardır:

1: Yeşil, mavinin üstünden.

2: Kırmızı, yeşilin üstünden.

3: Mavi, kırmızının üstünden.

Yapmanız gereken şey, bu işlemleri sondan başlayarak tekrarlamaktır. O halde hamleler şu sırayla yapılır:

Birinci hamle: Mavi, kırmızının üstünden.

İkinci hamle: Kırmızı, yeşilin üstünden.

Üçüncü hamle: Yeşil, mavinin üstünden.

Bu ikisi birleştirilip her örgü iki ucundan çekilirse, sonuç birim örgü olur. Deneyin ve sonucu kendi gözlerinizle görün.

Kağıt ve Örgü

Bir A4 kağıdını alın ve kağıda falçata yardımıyla aşağıdaki gibi kesikler atın:

Şimdi kağıdı iki ucundan tutup yan çevirin. Karşınıza bir tür örgü çıkacaktır:

Bi’ Göz Atmakta Fayda Var

  • Ali hocanın oyununda Emil Artin’in özelliklerinden nasıl yararlanabilirsiniz?
  • İkinci örnekte ipleri 90 derece sola yatırın. Soldan başlayarak iplerin kesişimlerini inceleyin. Ne görüyorsunuz?
  • Ali hocanın oyununu A4 kağıdı ile oluşturacağınız örgü ile oynayın. (Bunun için kağıda 3 veya 4 kesik atmanız yeterlidir.)

M. Serkan Kalaycıoğlu

Real Mathematics – Strange Worlds #18

Every year in December, each city changes drastically. Suddenly we find ourselves surrounded by decorations that remind us of the upcoming new year.

Steve the teacher starts to decorate his classrooms for the new year like he does every year. Though, Steve the teacher set his mind on using new year decorations for his mathematics lessons.

New Year Decorations Game (N.Y.D.G.)

Steve’s creation N.Y.D.G. is a multiplayer game. This is why the game is played in knockout stages/rounds. The winner of the game wins the new year decorations and gets to decorate the classroom as he/she wishes.

Content of N.Y.D.G.

  • In each knockout round, students are given 4 decorations as follows:
  • Players wind the decorations one another.
  • The winding procedure should be done secretly from the opponent.
  • Each player has at most four moves for winding.

Let’s use an example to explain what a “move” means during the winding procedure.

Assume that the first move is made with the red decoration as follows:

This counts as one move. The red one undergoes the blue and green decorations in this move. Let the next two moves are as follows:

In the second move, the yellow decoration undergoes the green and red ones, while the blue one passes over the green and yellow decorations. The illustration (up-right) shows us how the winding looks after these 3 moves.

In the end, winding gives us a braid.

The Goal of The Game

In any round, to knock your opponent out, you should solve the braid of your opponent faster than your opponent solves yours. (Solving a braid means, bringing the decorations to their first state. For instance, in the example given up, the first state is yellow-green-blue-red in order.)

Braids

Braids have a very important part in daily life. We encounter them not just in new year decorations, but also in a piece of cheese, a hairstyle, a basket or even in a bracelet:

In case you wish to understand what braids mean in mathematics; one can take a look at Austrian mathematician Emil Artin’s works from the 1920s.

Let’s call the following an identity braid from now on:

In Steve the teacher’s game, the ambition is to go back to the identity braid from a complex braid in the shortest amount of time. To do that, we can use Artin’s work on braids.

Example One: Solving two ropes.

Assume that we have two ropes tangles with each other as follows:

Red undergoes the green.

The inverse of this rope is:

Green undergoes the red.

If we combine these two ropes, when each rope to be stretched, the result will give us the identity braid:

Example Two: Solving three ropes.

Take three ropes and make a braid as follows:

There are three intersections in this braid:

1: Green over the blue.

2: Red over the green.

3: Blue over the red.

Now, you should repeat these steps, but from last to the first this time. Then, you should do these moves:

Move #1: Blue over the red.

Move #2: Red over the green.

Move #3: Green over the blue.

Finally, the combination will give you the identity braid. Try and see yourself.

Paper and Braids

Take an A4 paper and cut the paper using a knife like the following:

Then, hold the paper from its sides and rotate it 90 degrees to the left. You will end up with some kind of a braid:

One wonders…

  • How can you use Emil Artin’s work in the game of Steve the teacher?
  • In “example two”, rotate the ropes 90 degrees to the left. Start investigating the intersections from left to right. What do you notice?
  • Play Steve the teacher’s game with an A4 paper. (It is more than enough to use 3 or 4 cuts on the paper.)

M. Serkan Kalaycıoğlu

Real Mathematics – Graphs #7

Serkan’s System

Serkan the math teacher, hands out a specific number of problems to his students. Kids who can solve 1 or more of those problems would get a certain prize. At the beginning of each semester, Serkan and his students sit down and agree on what kind of prize is going to be distributed. For the current semester, oreo is chosen as the prize:

If Serkan the math teacher hands out 10 problems:

  • 10 Oreos for the kids who solved 10, 9 or 8 of those problems,
  • 5 Oreos for the kids who solved 7, 6 or 5 of those problems,
  • 2 Oreos for the kids who solved 4, 3 or 2 of those problems,
  • 1 oreo for the kids who solved 1 problem,
  • Absolutely nothing for the students who solved… well… none of those problems.

If you take a careful look at the numbers, you can see that Serkan the math teacher selected those numbers with a kind of logic: 10, 5, 2 and 1.

These are the natural numbers that can divide the number of the problems (that is 10) without any remainder.

Prize Distribution Machine (P.D.M.)

One month later…

Serkan the math teacher had faced some problems 4 weeks into the semester. He realized that it took hours to distribute the prizes since he has 10 classes in total.

Serkan the math teacher had to use almost all his free time in school to distribute the Oreos. This led him to think about a machine that would help him with the distribution:

  • P.D.M. will have 4 different compartments. (Because of 10, 5, 2 and 1.)
  • The volumes of those compartments will be measured with Oreos. They will be 10, 5, 2 and 1 Oreo-sized.
  • Oreos will enter the machine from the 10-Oreo-sized compartment. From there, Oreos will move to the other compartments using the connections that will be established.
  • Golden Rule: To establish a connection between any two compartments, the size of those compartments must be factors of one another.

Connections of the compartments for 10 problems:

  • For 10-Oreo-sized: 5, 2 and 1.
  • For 5-Oreo-sized: 10 and 1.
  • For 2-Oreo-sized: 10 and 1.
  • For 1-Oreo-sized: 10, 5, and 2.

Then, the sketch of the P.D.M. would look like the following:

Is this another graph?!

If you are familiar with graph theory (or if you read the graph section of the blog) you can recognize that the sketch of Serkan the math teacher’s machine is a planar graph:

You should connect the numbers (dots) using lines (connections) according to the golden rule.

One wonders…

What if Serkan the math teacher asks 12 problems?

For 12 problems, the numbers of prizes are going to be: 12, 6, 4, 3, 2 and 1.

In such a situation, can Serkan build his machine? In other words; is it possible to connect the dots for 12-sized P.D.M.?

Hint: First, you should consider where the lines should be. Also, you can arrange the dots in any order you’d like.

M. Serkan Kalaycıoğlu

Matematik Atölyesi – Graf #7

Serkan Hocanın Sistemi

Serkan hoca öğrencilerine her hafta belli sayıda soru verir. Bu sorulardan bir veya daha fazlasını çözen öğrenciler, çözdükleri soruların karşılığında bir ödül alır. Ödülü belirlemek için her dönem başında Serkan hoca ile sınıfları arasında bir anlaşma yapılır. Bu dönem için yapılan anlaşmaya göre ödül olarak oreo dağıtılacaktır:

10 soru verilirse:

  • 10, 9 ve 8’ini yapanlar 10 oreo,
  • 7, 6 ve 5’ini yapanlar 5 oreo,
  • 4, 3 ve 2’sinin yapanlar 2 oreo,
  • 1’ini yapanlar 1 oreo,
  • Hiç soru yapmayanlar ise oreo almayacaktır.

Dikkat edenler Serkan hocanın oreo ödüllerinin bir mantığı olduğunu anlamıştır: 10, 5, 2 ve 1.

Bunlar, soru sayısını (yani 10’u) kalansız bölen doğal sayılardır.

Ödül Dağıtım Makinesi (Ö.D.M.)

1 ay sonra…

Ödül sistemi başlayalı 4 hafta geçmişken Serkan hoca önemli bir sorunla karşı karşıya kalmıştı. Toplam 10 sınıfı olan Serkan hoca, her hafta birkaç saatini ödül dağıtmakla geçirmişti.

Neredeyse okuldaki tüm boş vaktini oreo dağıtmakla geçiren Serkan hoca, ödül dağıtımını kolayca halletmek için bir makine tasarlamayı düşünür:

  • Ö.D.M. 4 hazneden oluşacak. (10, 5, 2, ve 1’den dolayı.)
  • Haznelerin sırasıyla 10, 5, 2 ve 1 oreoluk kapasitesi olacak.
  • Makineye oreo girişi 10’luk hazneden olacak. Kurulan bağlantılarla diğer haznelere buradan oreo aktarılacak.
  • Altın Kural: Herhangi iki hazne arasında bağlantı olması için bu iki haznenin kapasiteleri birbirine kalansız bölünebiliyor olmalı.

10 soru için Ö.D.M. bağlantıları:

  • 10’luk hazne ile 5, 2 ve 1’likler arasında.
  • 5’lik hazne ile 10 ve 1’likler arasında.
  • 2’lik hazne ile 10 ve 1’likler arasında.
  • 1’lik hazne ile 10, 5 ve 2’likler arasında.

O halde Ö.D.M.’nin krokisi aşağıdaki gibi olur:

Yine mi graf?!

Graf teorisiyle tanışıklığınız varsa (veya blogda yer alan graf yazılarını okuduysanız), Serkan hocanın yarattığı sistemin aslında bir tür düzlemsel graf olduğunu fark etmişsinizdir:

10 soruluk Ö.D.M.’nin graf olarak gösterimi.

Birbirine kalansız bölünebilen sayılar (yani noktalar) arasında düzlemselliği bozmayacak şekilde (yani birbirini kesmeyecek şekilde) bağlantılar (yani çizgiler) çekilir.

Bi’ Göz Atmakta Fayda Var

Peki Serkan hoca soru sayısını değiştirip 12 yaparsa ne olur?

12 soru için ödüller 12’yi kalansız bölen doğal sayılardır: 12, 6, 4, 3, 2 ve 1.

Bu durumda Serkan hoca makinesini kurabilir mi? Bir diğer değişle 12’lik Ö.D.M. için bağlantılar (birbirini kesmeyecek şekilde) yerleştirilebilir mi?

Örnek dizilim.

İpucu: Önce hangi noktalar arasında çizgi çekilmeli ona bakın. Ayrıca noktalar istenilen şekilde dizilebilir.

M. Serkan Kalaycıoğlu

Real Mathematics – Algorithm #7

How to fail your math test algorithm (H.T.F.Y.M.T.A.)

The late 90s…

At last, there is a computer at home. Now a new battle emerged between Steve and his brothers: “whose turn it is for the computer?”. Thanks to his high grades at school, Steve won this battle easily. After his victory, Steve started to crush zombies in Carmageddon, won the Champions League in Fifa 98, and did such things in Duke Nukem which I can only tell you face to face over a cup of latte.

Steve’s computer game madness went berserk after he met with a football simulation game called Championship Manager. On top of all these games, at least a few days a week, Steve continued to play football&basketball with his friends. A disaster was waiting for him at the end of this road. How didn’t he foresee this?! He was about to fail all his tests in school!

The first warning was the math test. There was less than a day left for the test. Steve should have studied, but he developed some habits since he had a computer. Now, instead of studying, he had a various number of chances to waste time:

1.Staying at home

When Steve decided to stay home, he would get stuck to his computer. Anyone can guess that he was not using his pc for his school. He was just playing one of the following games:
a. Fifa
b. Carmageddon
c. Championship Manager

2.Going out

Whenever Steve went out, he was not going to the library to study:

a. Chase any ball (football or basketball)
b. Behave like a bum with your friends (a.k.a. meet with your friends and do absolutely nothing productive)

Graph of H.T.F.Y.M.T.A.

In the previous posts, I mentioned what graphs are and how they can be useful in certain situations. In Steve’s situation, using graphs can be very helpful to understand what is going on. Since Steve chooses not to study for his math test, his decisions will lead him to fail the test:

What does the graph tell us?

In the graph above, lines represent Steve’s choices, and dots represent at what state he is in after his choices. The graph tells us two certain things: Steve decides not to study and eventually he fails the math test.

This is why the lines that show Steve’s choices have directions.

During making choices, some steps cannot be skipped. For example, in order to play Fifa, Steve first should sit beside his computer, and to do that, he first should decide to stay home.

Let’s assume that Steve’s choices are like the following:

Stay home -> Turn on the pc -> Play Fifa.

In such a situation, since Steve has limited time before the test, he cannot play Fifa and then return and study for the test. After his decisions, there is no other country than “fail-town”.

Another thing the graph tells us is that Steve cannot go back after making a decision. Mathematicians call these kinds of graphs as “acyclic/chain digraphs”.


Some Information

Acyclic Digraphs

An acyclic digraph does not have a cycle. In other words, once you start moving on an acyclic digraph, you can never go back to the point you previously were at.

An acyclic (finite) digraph has at least one “source” and at least one “sink”.

A point is called “source” if it has no lines leading into it from any other point(s). A point is called “sink” if there are no edges from that point to any other point(s). In the graph of Steve, “don’t study” is the source, and “Result: F for fail” is the sink.


One wonders…

We all use acyclic digraphs during our daily lives. To show an example, I will use Steve’s life once again.

Every school day, Steve takes a shower as soon as he wakes up and gets ready for school. His steps are more or less like the following:

Wake up

Get into the shower

Brush teeth after shower

Get dressed

(Steve’s school uniform consists of pants, shirt, tie, and a vest.)

Q: Draw the graph that shows the way Steve gets ready for school.

Ps. After the shower, Steve must complete his tasks in the right direction. For example, he cannot put on his boxer before pants, can he?!

M. Serkan Kalaycıoğlu

Matematik Atölyesi – Algoritma #7

Sınavdan Çakma Algoritması (S.Ç.A.)

1990’ların sonu…

Eve sonunda bilgisayar alındı. Ali’nin abileriyle girdiği “bilgisayarı kullanma sırası kimde?” savaşından galip çıkmasının en önemli nedeni ders notlarının yüksekliği. Bu sayede Carmageddon’da zombi ezen, Fifa 98’de şampiyonlar ligini gol yemeden kazanan Ali’nin Duke Nukem’de neler yaptığını ise size ancak bir latte karşılığında anlatabilirim.

Ali’nin bir seneden uzun süren bilgisayar oyunu çılgınlığı menajerlik oyunlarıyla önünü alamadığı bir noktaya çıktı. Üstüne üstlük, hala haftada birkaç gün arkadaşlarıyla futbol&basketbol oynamaya da devam eden Ali, bir felakete doğru hızla ilerliyordu. Tanrım, nasıl da fark edememişti?! Sınavlarından çakmak üzereydi!

İlk uyarı matematik sınavıydı. Ali’nin sınava çalışması için önünde sadece son bir gün kalmıştı. Fakat Ali’de artık bazı alışkanlıklar baş göstermişti. Ders çalışmak yerine yapabileceği bir sürü seçeneği vardı:

1. Evde Kalmak

Ali evde kalmayı tercih ettiğinde hemen bilgisayarının başına oturuyordu. Bilgisayarı açmasının nedeni tabi ki dersleriyle alakalı değildi. Masaüstünde bulunan üç oyundan birini oynuyordu:

a. Fifa

b. Carmageddon

c. CM (Menajerlik oyunu)

2. Dışarı Çıkmak

Ali dışarı çıktığında da arkadaşlarıyla buluşup kütüphaneye gitmiyordu:

a. Top peşinde koş

b. Aylaklık yap

S.Ç.A. Grafı

Önceki yazılarda bahsettiğim graf konusu, Ali’nin durumunu açıklarken büyük bir kolaylık sağlar. Ali’nin ders çalışmamayı seçtiği durumlarda yapacağı tercihler sınavdan düşük not almasına yol açar:

Grafın Bize Anlattıkları

Yukarıdaki grafta çizgiler Ali’nin yaptığı seçimleri, noktalar ise Ali’nin hangi durumda olduğunu gösterir. Graf bize kesin olarak iki şeyi söyler: Ali, ders çalışmamayı seçer ve sonuçta sınavdan çakar.

Bu yüzden Ali’nin seçimlerini gösteren çizgilerin bir yönü vardır.

Seçimler yapılırken bazı adımlar atlanamaz. Örneğin, Fifa oynamak için önce bilgisayarın başına oturmak, onun için de evde kalmayı seçmek gerekir.

Ali’nin seçimlerinin aşağıdaki gibi olduğunu varsayalım:

Evde kal -> Bilgisayarı Aç -> Fifa oyna.

Bu durumda kısıtlı zamanı olan Ali’nin, zamanını Fifa oynamaya ayırdıktan sonra başa dönüp sınava çalışmasına olanak yoktur. Artık Ali için sınavdan kötü not almak kaçınılmaz bir son olacaktır.

Grafın bize anlattığı bir başka şey ise, Ali’nin yaptığı herhangi bir seçime geri dönememesidir. Matematikçiler bu tür grafları “yönlü çevrimsiz/asiklik/zincirleme graf” olarak adlandırmıştır.

***

Biraz Bilgi

Yönlü Çevrimsiz Graf

Bir yönlü çevrimsiz grafta döngü yoktur. Yani bir noktadan başlayıp yönlü çizgileri takip ettiğinizde, aynı noktaya bir daha dönemezsiniz.

Yönlü (ve sonlu) çevrimsiz graflarda en az bir “kaynak” ve yine en az bir “alış noktası” olarak adlandırılan noktalar bulunur.

Kaynak noktası, başka herhangi bir noktadan kendisine doğru çizgi gelmeyen noktadır. Yukarıdaki grafta “ders çalışma” isimli nokta, kaynak noktasıdır.

Alış noktası ise kendisinden başka herhangi bir noktaya doğru çizgi gitmeyen noktadır. Grafımızda “sınavdan çak” isimli nokta, alış noktasıdır.

***

Bi’ Göz Atmakta Fayda Var

Rutin işlerinizi yaparken aslında yönlü çevrimsiz grafları kullanıyorsunuz. Buna bir örnek göstermek için yine Ali’nin hayatından yararlanacağım.

Ali, her okul günü sabahında uyanır uyanmaz duş alıp okula hazırlanır. Bunu yaparken Ali’nin izlediği yol şunlardan oluşur:

Uyan

Duşa gir

Duş sonrası diş fırçala

Giyin

(Ali’nin okul kıyafeti pantolon, gömlek, kravat ve yelekten oluşuyor.)

Soru: Ali’nin okula hazırlanışını gösteren grafı çizin.

Not: Ali duştan sonra giyinirken her adımı doğru yönde tamamlamalıdır. Örneğin boxer’ını giymeden önce pantolonunu giyemez, değil mi?!

M. Serkan Kalaycıoğlu

Matematik Atölyesi – Algoritma #6

2600ler…

Sonunda Dünya dışında yaşayabileceğimiz bir gezegen keşfedildi. Bilim insanlarının T-489 ismini verdiği bu gezegende yaşam koşulları Dünya’ya benzer görünüyor. Uydu görüntüleri T-489’da su bulunduğunu gösterirken gezegenin atmosferinin de Dünya’nınki ile tıpatıp aynı olduğu keşfedildi.

T-489’un bulunduğu sistem.

Büyük devletlerin uzay ajansları ortak bir ekip gönderip T-489’da yaşam olup olmadığını kontrol etmekte anlaştı. Hazırlanan plana göre uydu görüntülerinden elde edilen veriler ışığında T-489’da belirlenen bir noktaya inecek ilk ekip, burada güvenli alan ve merkez üs oluşturacak.

Güvenli alan oluşturulduktan sonra ise yine uydu sayesinde belirlenmiş olan noktalara üç ayrı ekip gönderilecek. Bu ekipler hem bulundukları bölgelerde yaşam koşullarını inceleyecek, hem de farklı yaşam formları olup olmadığını kontrol edecek.

T-489’da bulunan merkez üs, keşfe çıkacak ekipler için bir harita yapacak. Merkez üssün hazırladığı harita hem gezegen üzerinde yolculuğun nasıl yapılabileceğini, hem de ekiplerden herhangi birinin sorun yaşaması durumunda üsse nasıl geri dönmesi gerektiğini açıklamak zorunda.

Haritanın görünümü: Sarı nokta merkez üs, diğer noktalar ise keşif ekiplerinin ziyaret edeceği konumlar.

Herhangi bir anda bir ekibin nerede olduğunun bilinemeyeceği durumlar için merkez üste çalışanlar çizdikleri haritaya bir de algoritma eklemeli. Bu, öyle bir algoritma olmalı ki, algoritmayı takip eden ekip(ler) sonunda merkez üsse varır.

Yol Boyama Problemi

1970’de Roy Adler’in ortaya attığı bir problem olan yol boyama problemi (road coloring problem), 2007’de yılında İsrailli matematikçi Trahtman tarafından çözülmüştü.

Trahtman, yukarıdaki gibi bir graf (veya harita) düşünmüştü; noktalar arasında bulunan yolların belirli yön ve renkleri vardı. Bu yön ve renkleri bulduğu algoritmaya göre oluşturan Trahtman’a göre grafın herhangi bir noktasından başlayıp üç kere mavi-kırmızı-kırmızı yolları izleyen biri her zaman sarı noktada duracaktır.

T-489’da Kaos

Gezegende keşfe çıkacak ekipler için harita yapmanız gerekiyor. Merkez üs ve gezilmesi gereken noktalar aşağıdaki gibi:

Keşif ekiplerinin yaşayabileceği en kötü duruma hazırlanmanız gerekiyor. Eğer ekiplerden birinin iletişimi kopar ve haritaya ulaşma şansı kalmazsa, yaratacağınız algoritma hayatlarını kurtaracaktır.

Geliştirdiğiniz fikir şöyle ilerliyor: Gidilmesi gereken her konumun girişine bir tabela konulacak. Bu tabelalarda sadece yolun yönü ve rengi yazacak. (Tabelalara haritaların asılmamasının nedeni, zeki bir uzaylı türüyle karşılaşılması durumunda merkez üssün yerinin direk uzaylılara gösterilmemesidir.)

Yarattığınız algoritmaya göre iki defa kırmızı-mavi yapmak ekipleri merkez üsse ulaştırır:

Bi’ Göz Atmakta Fayda Var

Keşif yapılacak bir nokta daha olsun. Haritanız için öyle bir algoritma yaratın ki, izlenen algoritma sizi hep M noktasına (yani merkez üsse) geri döndürsün.

(Bunu yaparken en az sayıda yol kullanmaya özen gösterin.)

Real Mathematics – Algorithm #6

The year 2600…

Finally, we discovered a planet where we can live besides Earth. Scientists named this planet as T-489. The living conditions in T-489 seems very much like the Earth’s. Satellite views show that there is water on this planet. And scientists discovered that the atmosphere on this planet is almost the same as Earth’s atmosphere.

T-489 and its system.

Space agencies of the world’s biggest countries gathered a team to discover T-489. According to the plan, the first team that lands on T-489 will secure the landing point and build a headquarter. This point is set beforehand with the use of the satellite photos.

After the completion of the headquarters, three separate teams will be sent to T-489 to discover certain points on the planet that was set beforehand. These teams will be searching for the possible existence of life forms as well as testing the life conditions on each location.

The map: Headquarters is at the yellow point. Other points must be discovered by the teams. In an emergency, teams can use the roads and return to the headquarters.

The headquarter of T-489 should develop a map for those three teams which will be scouting the planet. This map is crucial since it will show how those teams should travel on the planet, and it will also explain how a team can return to the headquarters in case of an emergency.

In certain situations such as not knowing where a team is at a given time, headquarters must add an algorithm to the map. This way, in an emergency, any team can use this algorithm and return to the headquarters safely.

Road Coloring Problem

In 1970, Roy Adler suggested the road coloring problem. After almost 40 years, an Israeli mathematician called Trahtman solved this problem.

Yellow point the headquarters. Select a point and use the roads that in this order three times: blue-red-red. You will always end up at the yellow point.

Trahtman thought of the map as a graph shown above; each road had a direction and a distinct color. Trahtman created these directions and colors such that, following a certain algorithm, your travel would always end up on a specific point. In this example, the algorithm is following blue-red-red roads three times and always ending up at the yellow point. You can try at any point and see by yourself.

Chaos on T-489

You must develop a map for the teams that will be scouting the planet. Headquarters and the locations to visit are shown as follows:

M is the headquarters. A, B and C are the points to be discovered by the teams.

You should prepare for the worst possible scenario. If the connection breaks between the headquarters and the scouting teams, and if those teams can’t access to the map, your algorithm might save their lives.

The idea is: Place a sign on the entry of each point. These signs will have only two pieces of information: The color and the direction of the roads. (Why don’t you just hang the map on these signs? Because you are not sure if there is an alien life form on the planet. And in case they exist, such maps might put the headquarters and the whole mission at danger.)

Let’s say you created a map as follows:

Such a map would have an algorithm like this: Follow red-blue twice, and you will always return to the headquarters.

One wonders…

Create a map and an algorithm that will let you arrive at the point M in each time.

Let’s say that there is one more point added to the discovery. Create a map and an algorithm such that, whenever you use the algorithm you will end up at the headquarters.

(Try to use the least number of roads on your map.)

M. Serkan Kalaycıoğlu